
BEES
Building a modular dashboard
Building a modular dashboard
This was a design-driven project with the goal of exploring a flexible and scalable solution for Deliver Portal's KPI dashboard, while also pitching a potential future state to stakeholders.
This was a design-driven project with the goal of exploring a flexible and scalable solution for Deliver Portal's KPI dashboard, while also pitching a potential future state to stakeholders.
This was a design-driven project with the goal of exploring a flexible and scalable solution for Deliver Portal's KPI dashboard, while also pitching a potential future state to stakeholders.
Role
Role
UX Product Designer
UX Product Designer
Application
Application
Deliver Portal
Deliver Portal
Tools
Tools
Figma, Sketch
Figma, Sketch
Discover
Discover
Route analysts rely on the Deliver Portal to monitor and optimize daily delivery routes. The previous KPI dashboard provided a one-size-fits-all experience, displaying a fixed set of metrics across all distribution centers. However, analysts have varying priorities depending on factors like customer distance, fleet size, and operational goals. Through user research and stakeholder discussions, we identified a key blocker for users: a complete lack of customization, which forced analysts to work around the system rather than with it.
Route analysts rely on the Deliver Portal to monitor and optimize daily delivery routes. The previous KPI dashboard provided a one-size-fits-all experience, displaying a fixed set of metrics across all distribution centers. However, analysts have varying priorities depending on factors like customer distance, fleet size, and operational goals. Through user research and stakeholder discussions, we identified a key blocker for users: a complete lack of customization, which forced analysts to work around the system rather than with it.
Route analysts rely on the Deliver Portal to monitor and optimize daily delivery routes. The previous KPI dashboard provided a one-size-fits-all experience, displaying a fixed set of metrics across all distribution centers. However, analysts have varying priorities depending on factors like customer distance, fleet size, and operational goals. Through user research and stakeholder discussions, we identified a key blocker for users: a complete lack of customization, which forced analysts to work around the system rather than with it.
User persona
User persona

Goals
Goals
Goals
Monitoring KPIs to understand health of DC
Support drivers & clients
Help with solving refusals
Monitoring KPIs to understand health of DC
Support drivers & clients
Help with solving refusals
Monitoring KPIs to understand health of DC
Support drivers & clients
Help with solving refusals
Opportunities
Opportunities
Opportunities
Lack full visibility of routes and delivery details
Difficulty reaching out to drivers
LImited customization across entire application
Lack full visibility of routes and delivery details
Difficulty reaching out to drivers
LImited customization across entire application
Lack full visibility of routes and delivery details
Difficulty reaching out to drivers
LImited customization across entire application
Original state
Original state
Originally, the Deliver Portal was limited in both functionality and design, offering users no control over the information displayed on their dashboard. To better understand these limitations, I conducted a design audit guided by Jakob Nielsen’s 10 Heuristics for UX, identifying key usability gaps such as flexibility, user control, and visibility of system status.
Originally, the Deliver Portal was limited in both functionality and design, offering users no control over the information displayed on their dashboard. To better understand these limitations, I conducted a design audit guided by Jakob Nielsen’s 10 Heuristics for UX, identifying key usability gaps such as flexibility, user control, and visibility of system status.
Originally, the Deliver Portal was limited in both functionality and design, offering users no control over the information displayed on their dashboard. To better understand these limitations, I conducted a design audit guided by Jakob Nielsen’s 10 Heuristics for UX, identifying key usability gaps such as flexibility, user control, and visibility of system status.

Define
Define
After revisiting our user persona and and auditing the current state of Deliver Portal's KPI dashboard, we drafted our problem statement to define our core issues and guide our design decisions moving forward.
After revisiting our user persona and and auditing the current state of Deliver Portal's KPI dashboard, we drafted our problem statement to define our core issues and guide our design decisions moving forward.
After revisiting our user persona and and auditing the current state of Deliver Portal's KPI dashboard, we drafted our problem statement to define our core issues and guide our design decisions moving forward.
Problem statement
Problem
statement
Problem
statement
The Deliver PortaI's KPI dashboard provides a static, one-size-fits-all experience, limiting route analysts’ ability to customize their workflow. Since different distribution centers prioritize different metrics, the lack of flexibility forces analysts to rely on inefficient workarounds to track key performance indicators.This project aims to explore a modular, scalable dashboard solution that allows analysts to tailor their view to their specific needs while maintaining consistency across the platform. By enhancing user control and adaptability, we can improve efficiency and decision-making for route analysts.
The Deliver PortaI's KPI dashboard provides a static, one-size-fits-all experience, limiting route analysts’ ability to customize their workflow. Since different distribution centers prioritize different metrics, the lack of flexibility forces analysts to rely on inefficient workarounds to track key performance indicators.This project aims to explore a modular, scalable dashboard solution that allows analysts to tailor their view to their specific needs while maintaining consistency across the platform. By enhancing user control and adaptability, we can improve efficiency and decision-making for route analysts.
The Deliver PortaI's KPI dashboard provides a static, one-size-fits-all experience, limiting route analysts’ ability to customize their workflow. Since different distribution centers prioritize different metrics, the lack of flexibility forces analysts to rely on inefficient workarounds to track key performance indicators.This project aims to explore a modular, scalable dashboard solution that allows analysts to tailor their view to their specific needs while maintaining consistency across the platform. By enhancing user control and adaptability, we can improve efficiency and decision-making for route analysts.
Objectives
Increase customization & flexibility.
Allow users to tailor their dashboard to specific priorities and preferences.
Enhance data accessbility.
Ensure users can easily interpret KPIs without unnecessary friction.
Boost engagement & adoption.
Design an experience that encourages both regular use and empowers decision making.
Design
Design
The design phase focused on developing a modular solution with interchangeable widgets, allowing route analysts to tailor their dashboard to their specific needs. Through competitive research and reading findings on best practice, I analyzed similar solutions to identify industry standards and ensure our approach offered a unique advantage. I explored and iterated on different elements of modular design to find what would work best in this new feature.
The design phase focused on developing a modular solution with interchangeable widgets, allowing route analysts to tailor their dashboard to their specific needs. Through competitive research and reading findings on best practice, I analyzed similar solutions to identify industry standards and ensure our approach offered a unique advantage. I explored and iterated on different elements of modular design to find what would work best in this new feature.
The design phase focused on developing a modular solution with interchangeable widgets, allowing route analysts to tailor their dashboard to their specific needs. Through competitive research and reading findings on best practice, I analyzed similar solutions to identify industry standards and ensure our approach offered a unique advantage. I explored and iterated on different elements of modular design to find what would work best in this new feature.
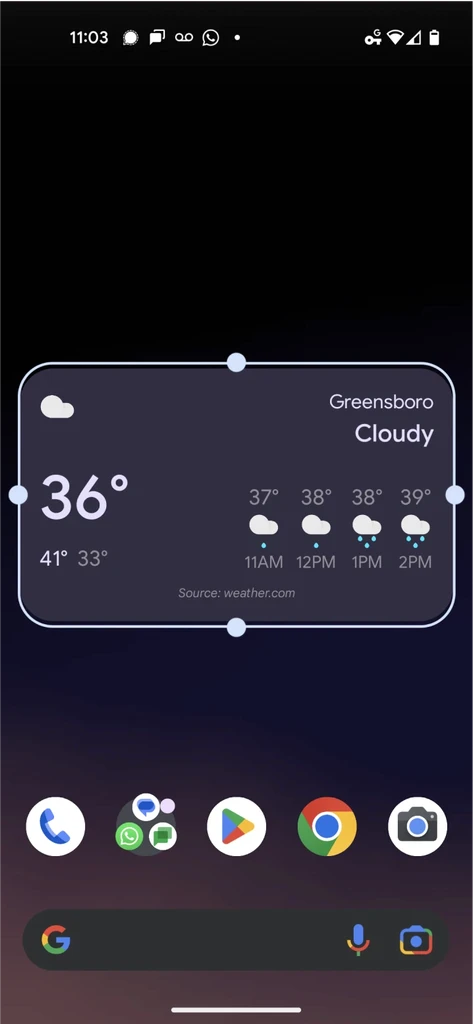
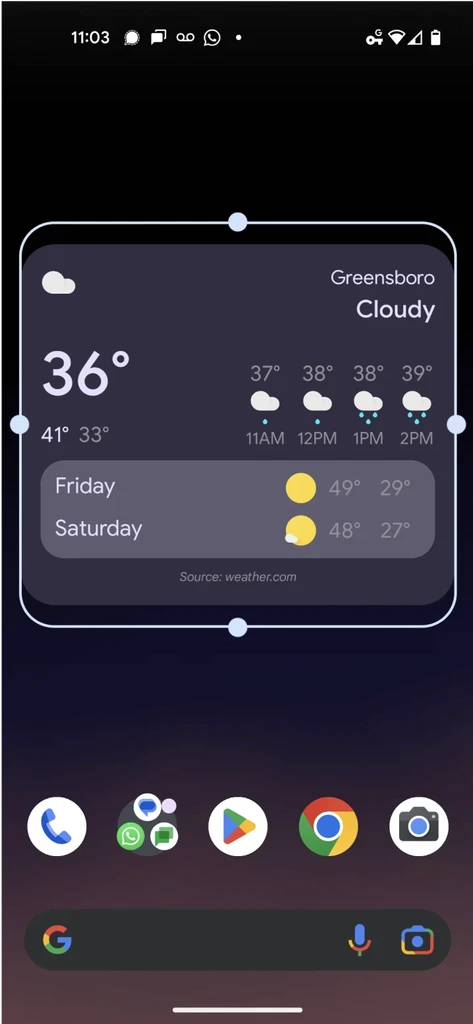
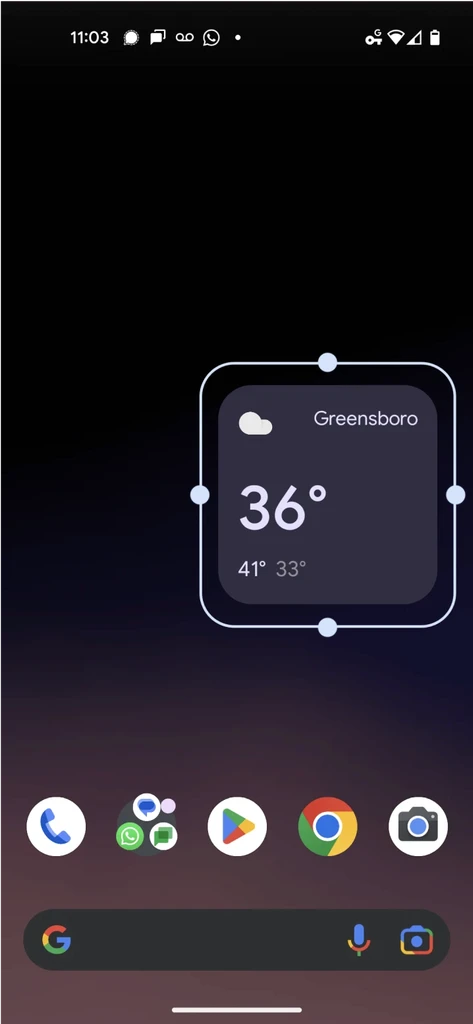
Scalable widgets
Scalable widgets
Before working on any layouts for dashboard, it was important to ensure that each widget was not only responsive, but also dynamic, showing content based on how much space is available.
Before working on any layouts for dashboard, it was important to ensure that each widget was not only responsive, but also dynamic, showing content based on how much space is available.
Before working on any layouts for dashboard, it was important to ensure that each widget was not only responsive, but also dynamic, showing content based on how much space is available.

Drag to resize
I looked into Android's widget design as an option for resizing.


Drag to resize
I looked into Android's widget design as an option for resizing.
Dashboard presets
Dashboard presets
Instead, allowing users to select a layout from a series of presets was a more intuitive option. It was also a simpler technical solution, making it an easier deliverable for our engineering team.
Instead, allowing users to select a layout from a series of presets was a more intuitive option. It was also a simpler technical solution, making it an easier deliverable for our engineering team.
Instead, allowing users to select a layout from a series of presets was a more intuitive option. It was also a simpler technical solution, making it an easier deliverable for our engineering team.

Sketches
Sketches
With all the design elements picked out, I started sketching to figure out how it would all come together. It's an easy way to weed out conflicting elements and evolve the concept further before committing time to create a high fidelity prototype.
With all the design elements picked out, I started sketching to figure out how it would all come together. It's an easy way to weed out conflicting elements and evolve the concept further before committing time to create a high fidelity prototype.
With all the design elements picked out, I started sketching to figure out how it would all come together. It's an easy way to weed out conflicting elements and evolve the concept further before committing time to create a high fidelity prototype.

Test
Test
To validate the design, we conducted usability testing with six route analysts across six different locations. While the quantitative results did not meet initial expectations, users showed strong receptiveness to customization and with one or two design tweaks, it was a viable solution.
To validate the design, we conducted usability testing with six route analysts across six different locations. While the quantitative results did not meet initial expectations, users showed strong receptiveness to customization and with one or two design tweaks, it was a viable solution.
To validate the design, we conducted usability testing with six route analysts across six different locations. While the quantitative results did not meet initial expectations, users showed strong receptiveness to customization and with one or two design tweaks, it was a viable solution.
We tested with 6 users.
We tested with 6 users.
2 users were able to customize their dashboard successfully.
2 users were able to customize their dashboard successfully.
3 users could not complete the task. Customization was a completely new concept to them.
3 users could not complete the task. Customization was a completely new concept to them.
1 user performed the task after some guidance.
1 user performed the task after some guidance.
User 1
User 2
User 3
User 4
User 5
User 6
We tested with 6 users.
User 1
User 2
User 3
User 4
User 5
User 6
Iterate
Iterate
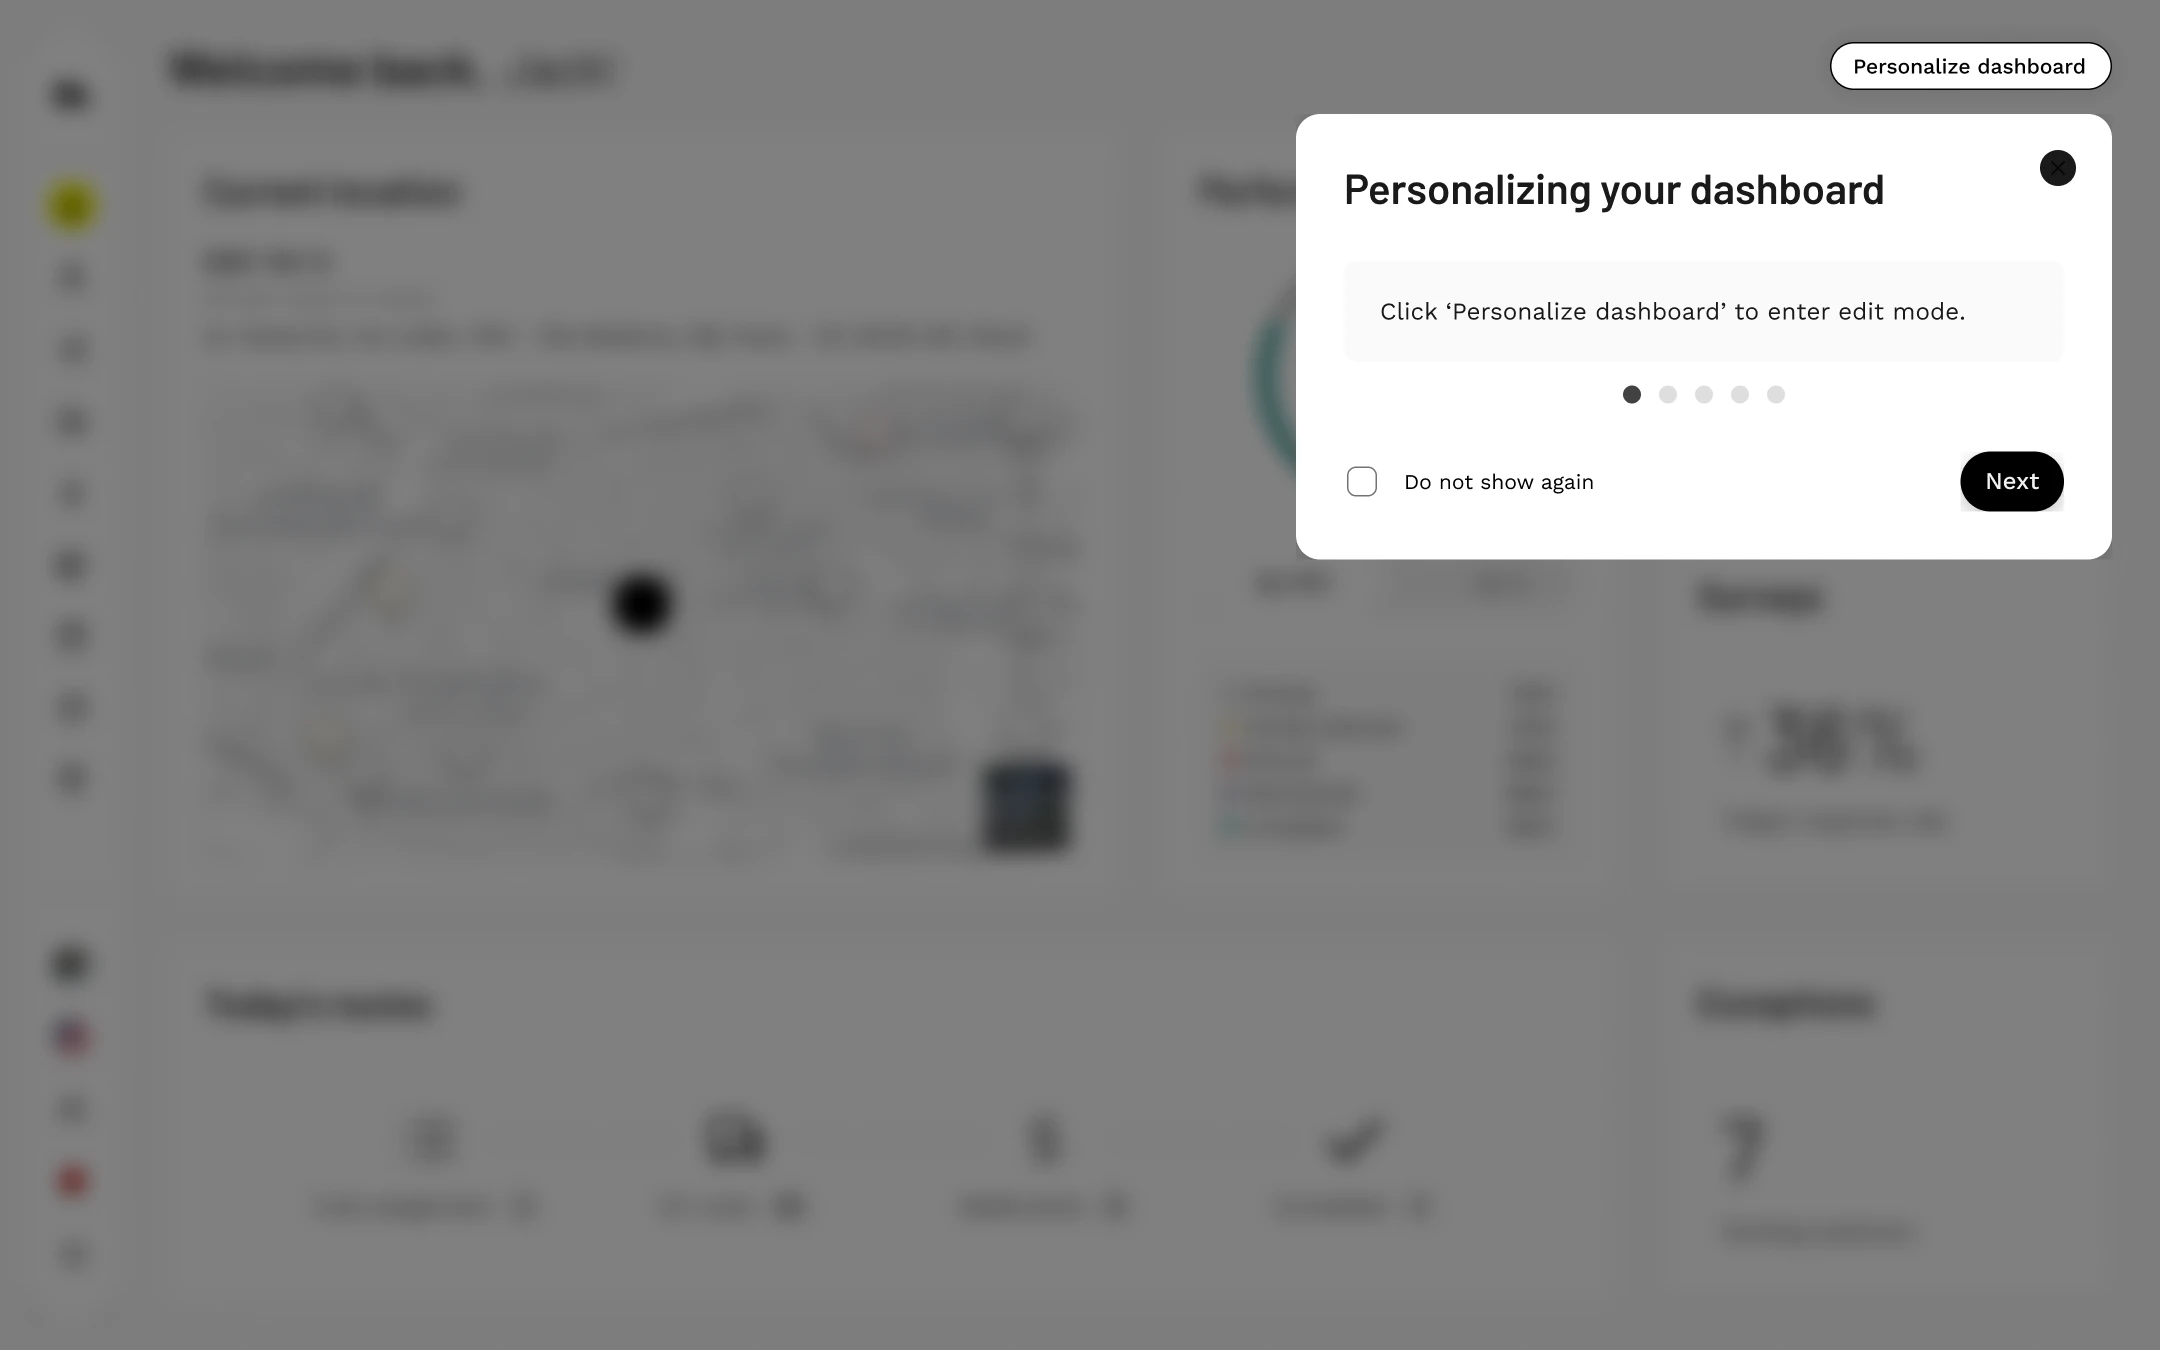
Based on the feedback, the final iteration of the modular dashboard incorporated an onboarding tutorial to guide users through customization options. This ensured that route analysts could quickly understand and take advantage of the new feature without friction.
The updated dashboard now provides route analysts with a flexible, personalized workspace, improving their efficiency and ability to support drivers and customers effectively. By implementing modular customization, we transformed the dashboard into a dynamic tool that adapts to the unique needs of each user.

Final design
Final design
Outcomes
Efficient data discovery
Customization allows for faster decision-making.
Higher user satisfaction.
Improved the UX with a solution that caters to more diverse use cases.
Scalability for future needs.
A modular approach ensures that the dashboard can grow alongside evolving business and user needs.
Final thoughts
Final
thoughts
Final
thoughts
Challenges arose when introducing the new concept of customization to route analysts, but testing and user feedback guided the ultimate solution. By incorporating an onboarding tutorial, we ensured smoother adoption and usability. This project underscores the need to integrate innovation with effective user onboarding, ensuring that users can seamlessly adopt new tools to enhance their efficiency and effectiveness.
Challenges arose when introducing the new concept of customization to route analysts, but testing and user feedback guided the ultimate solution. By incorporating an onboarding tutorial, we ensured smoother adoption and usability. This project underscores the need to integrate innovation with effective user onboarding, ensuring that users can seamlessly adopt new tools to enhance their efficiency and effectiveness.
Challenges arose when introducing the new concept of customization to route analysts, but testing and user feedback guided the ultimate solution. By incorporating an onboarding tutorial, we ensured smoother adoption and usability. This project underscores the need to integrate innovation with effective user onboarding, ensuring that users can seamlessly adopt new tools to enhance their efficiency and effectiveness.